Build Office editing and calculation into your product.
Six Office tools in your UI, headless processing in the background, and Web Apps bound to cells.
Embed Office editors in your product.
Pick the tools you need. People edit Office content right in your product.
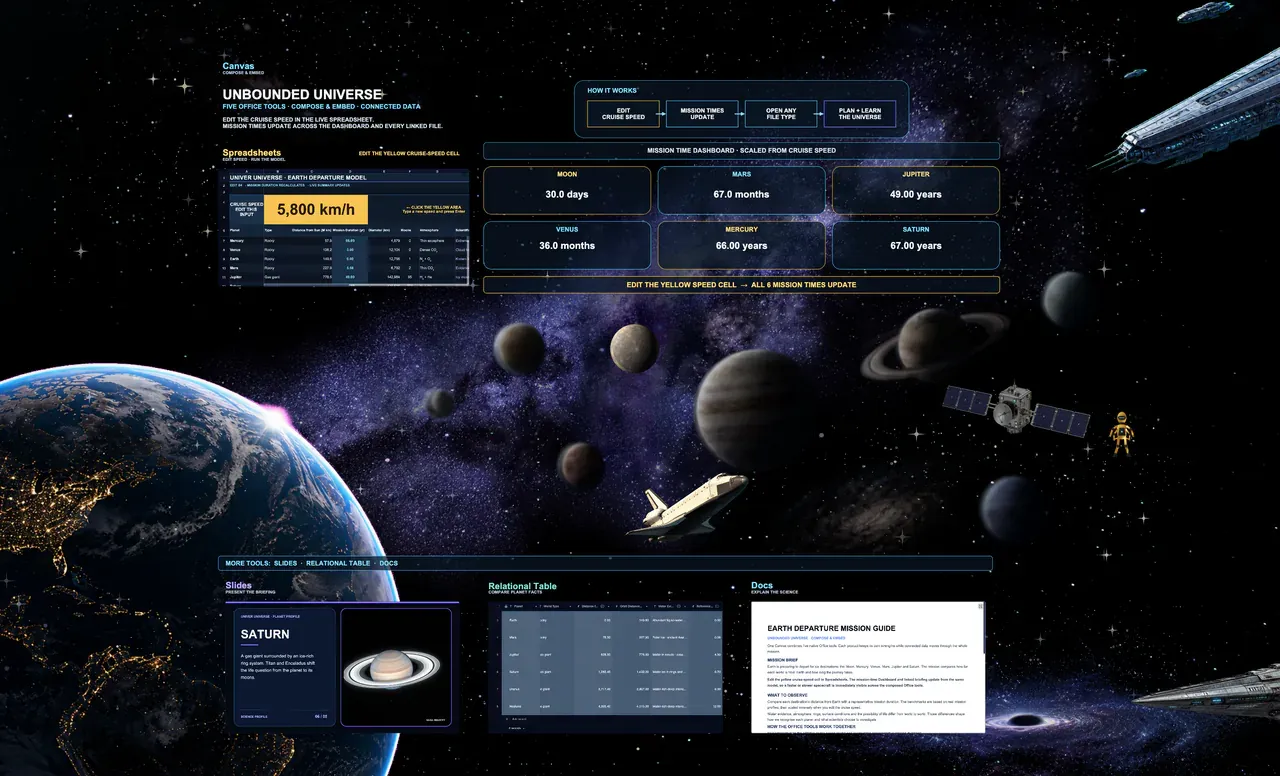
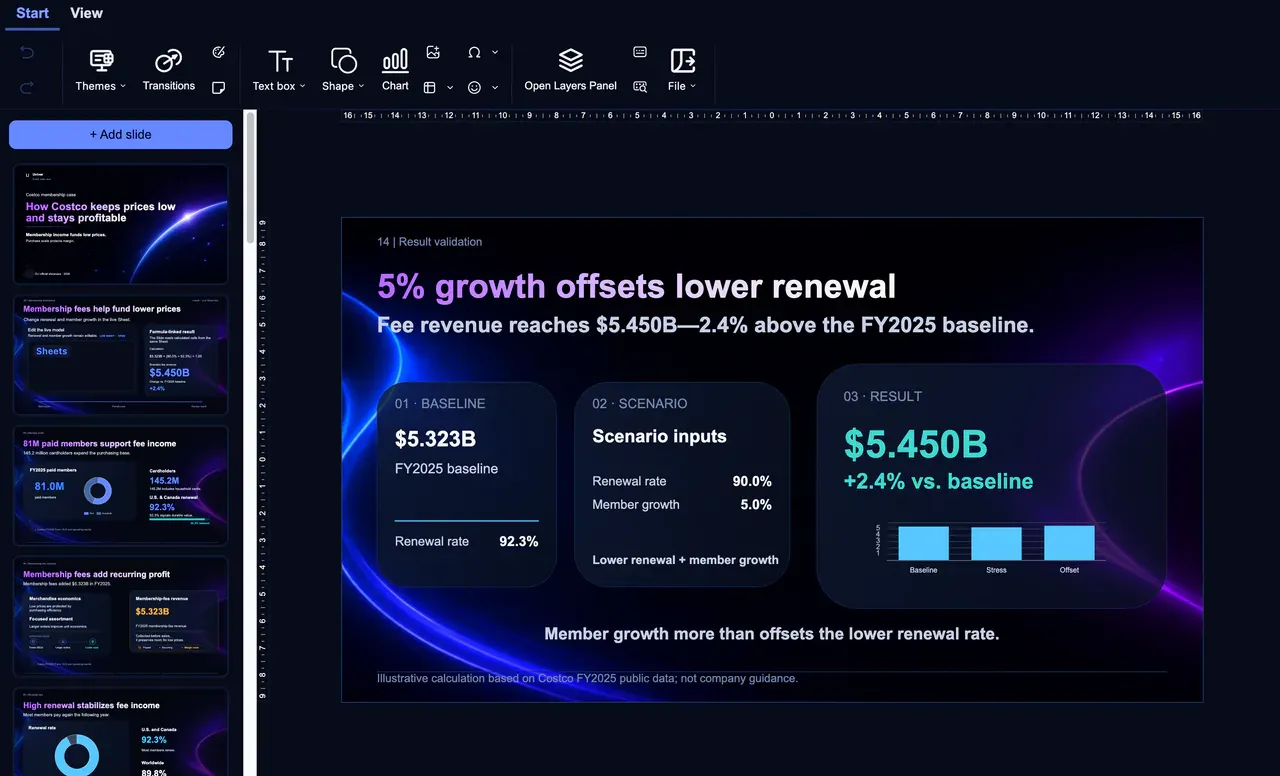


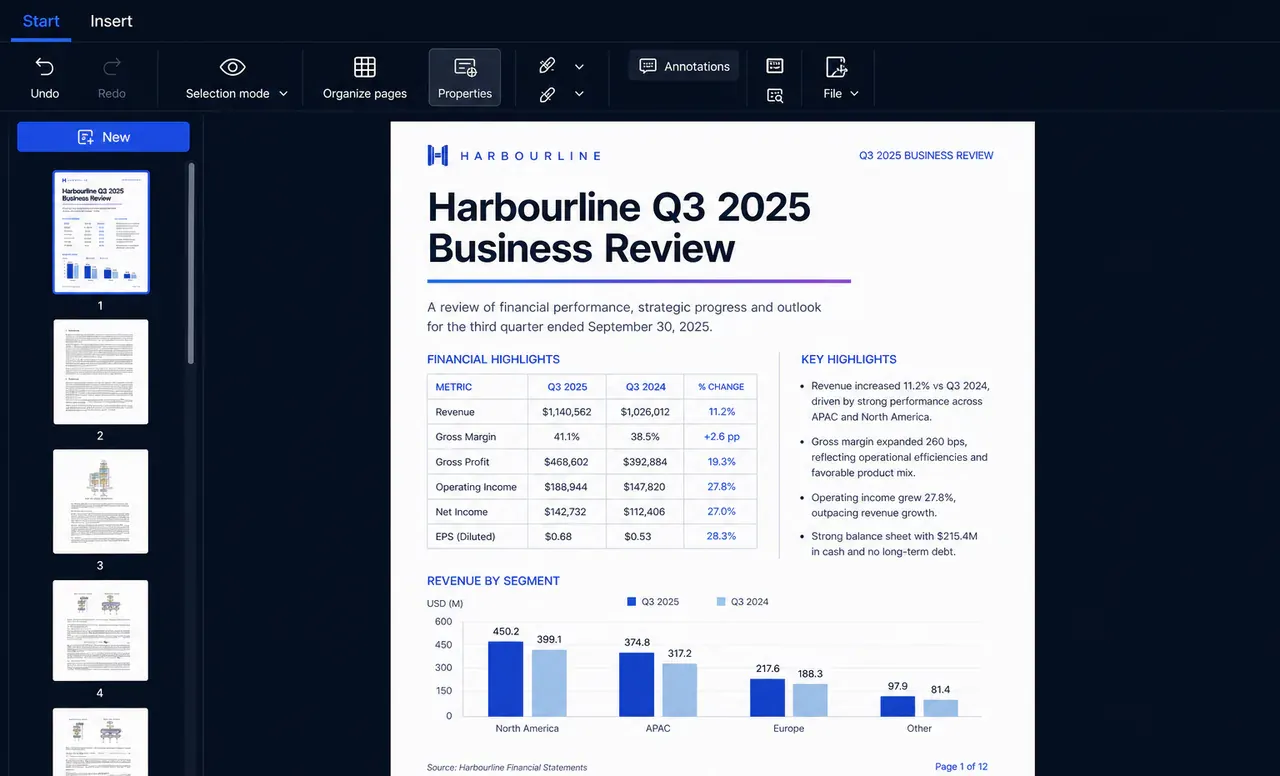
Univer · One office environment
Sheets, docs, slides and canvases in one .univer file, with content, data and references connected.
- Editable sheets in slides; data cited in docs
- References and bindings link source data
- People and agents edit one file, traceably
Web App
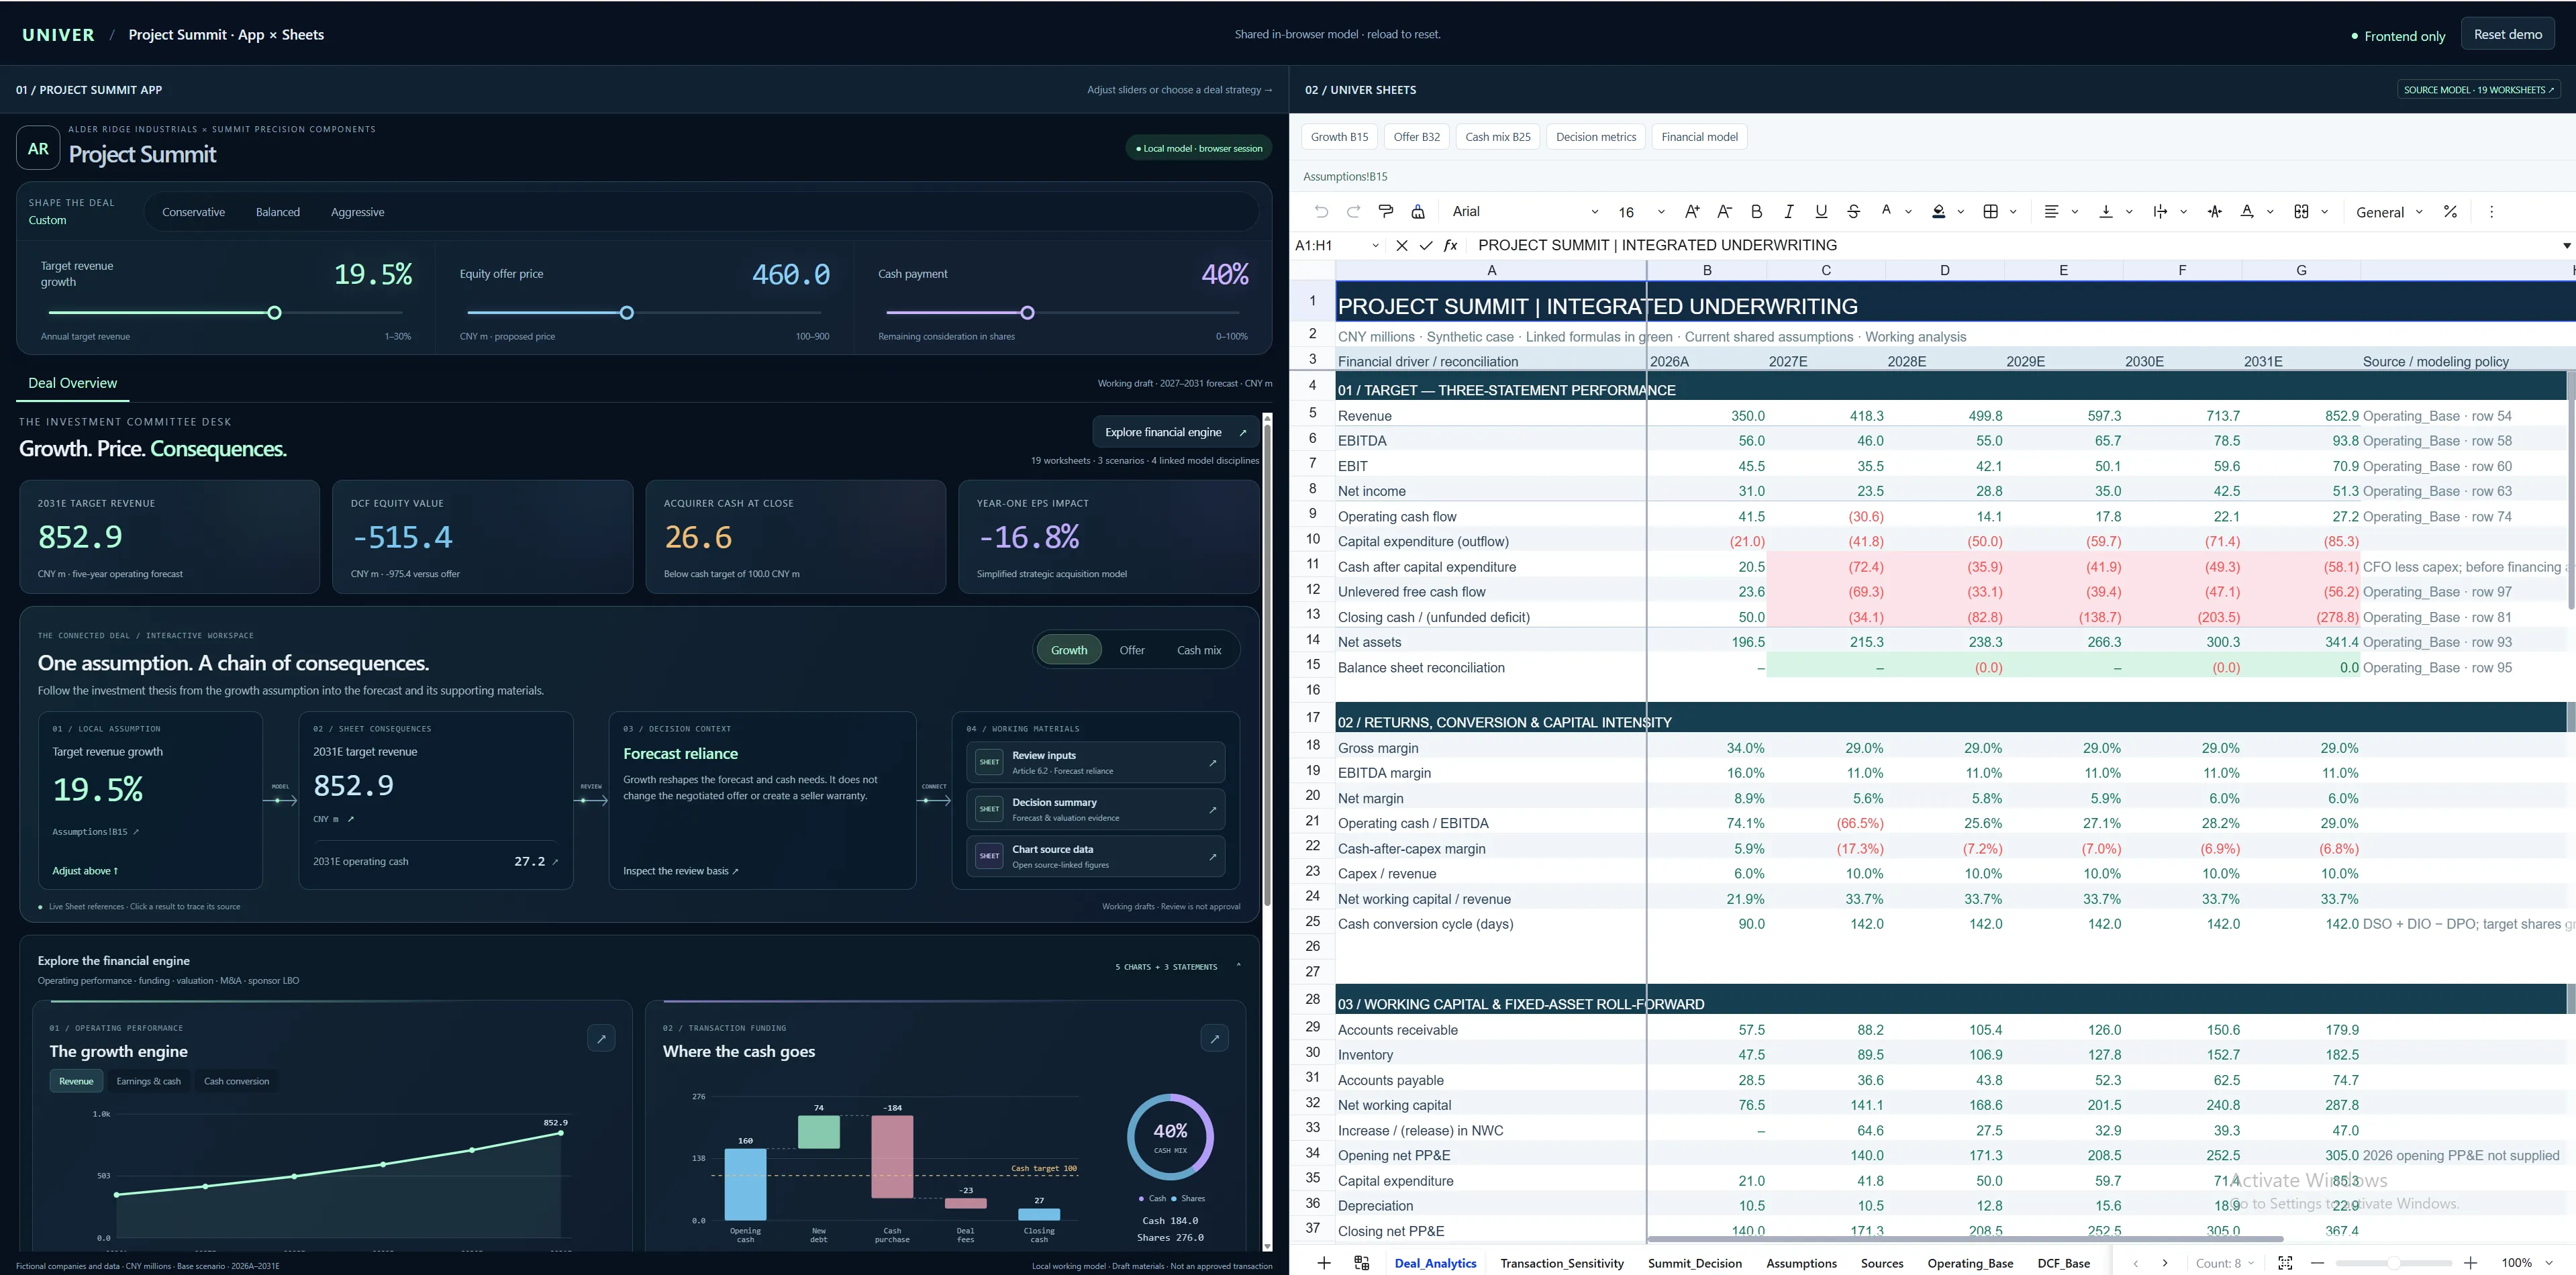
Build Web Apps with two-way spreadsheet binding and real-time collaboration.
- Two-way binding between controls and cells
- Shared spreadsheet data and formulas
- Live updates across metrics and charts
Sheets
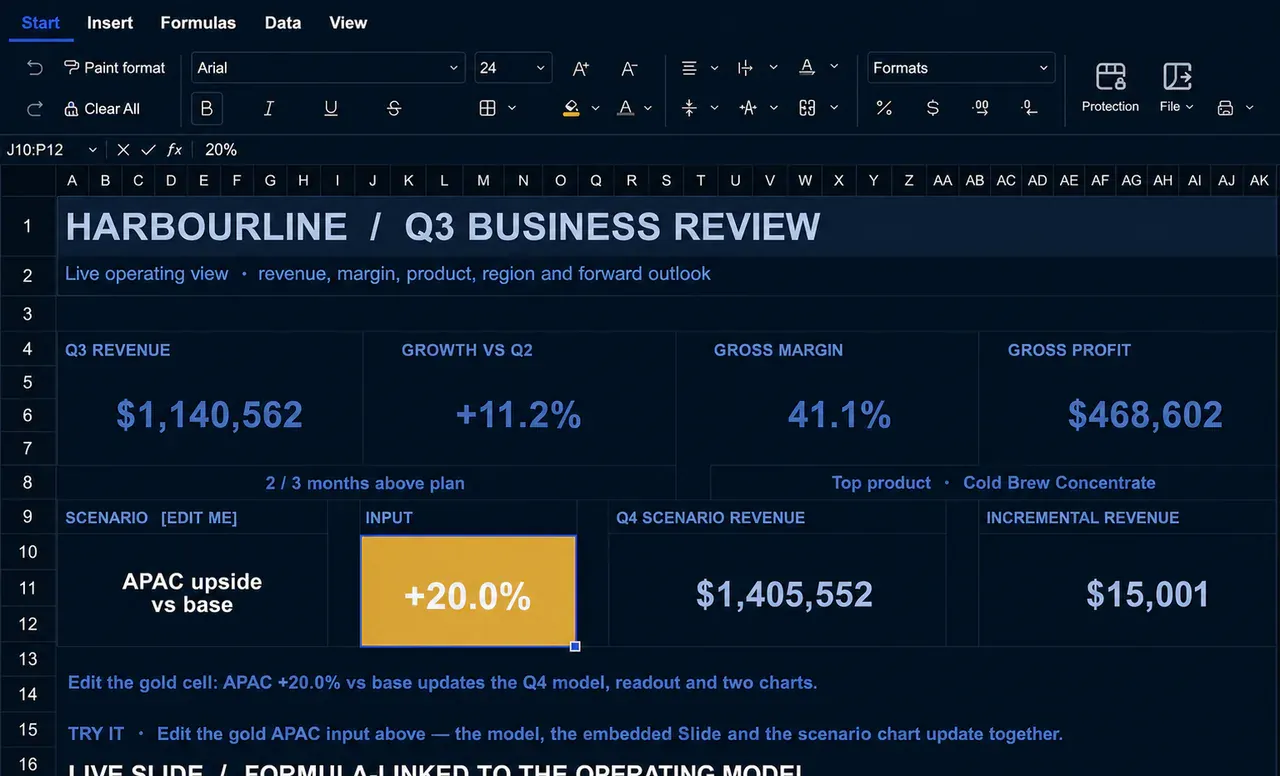
Spreadsheet editing, formulas and analysis in your product, or calculated in the background.
- Formulas, conditional formatting, validation, pivot tables
- Sort, filter, freeze, group, number formats
- Editable charts, images, shapes, rich text
Docs
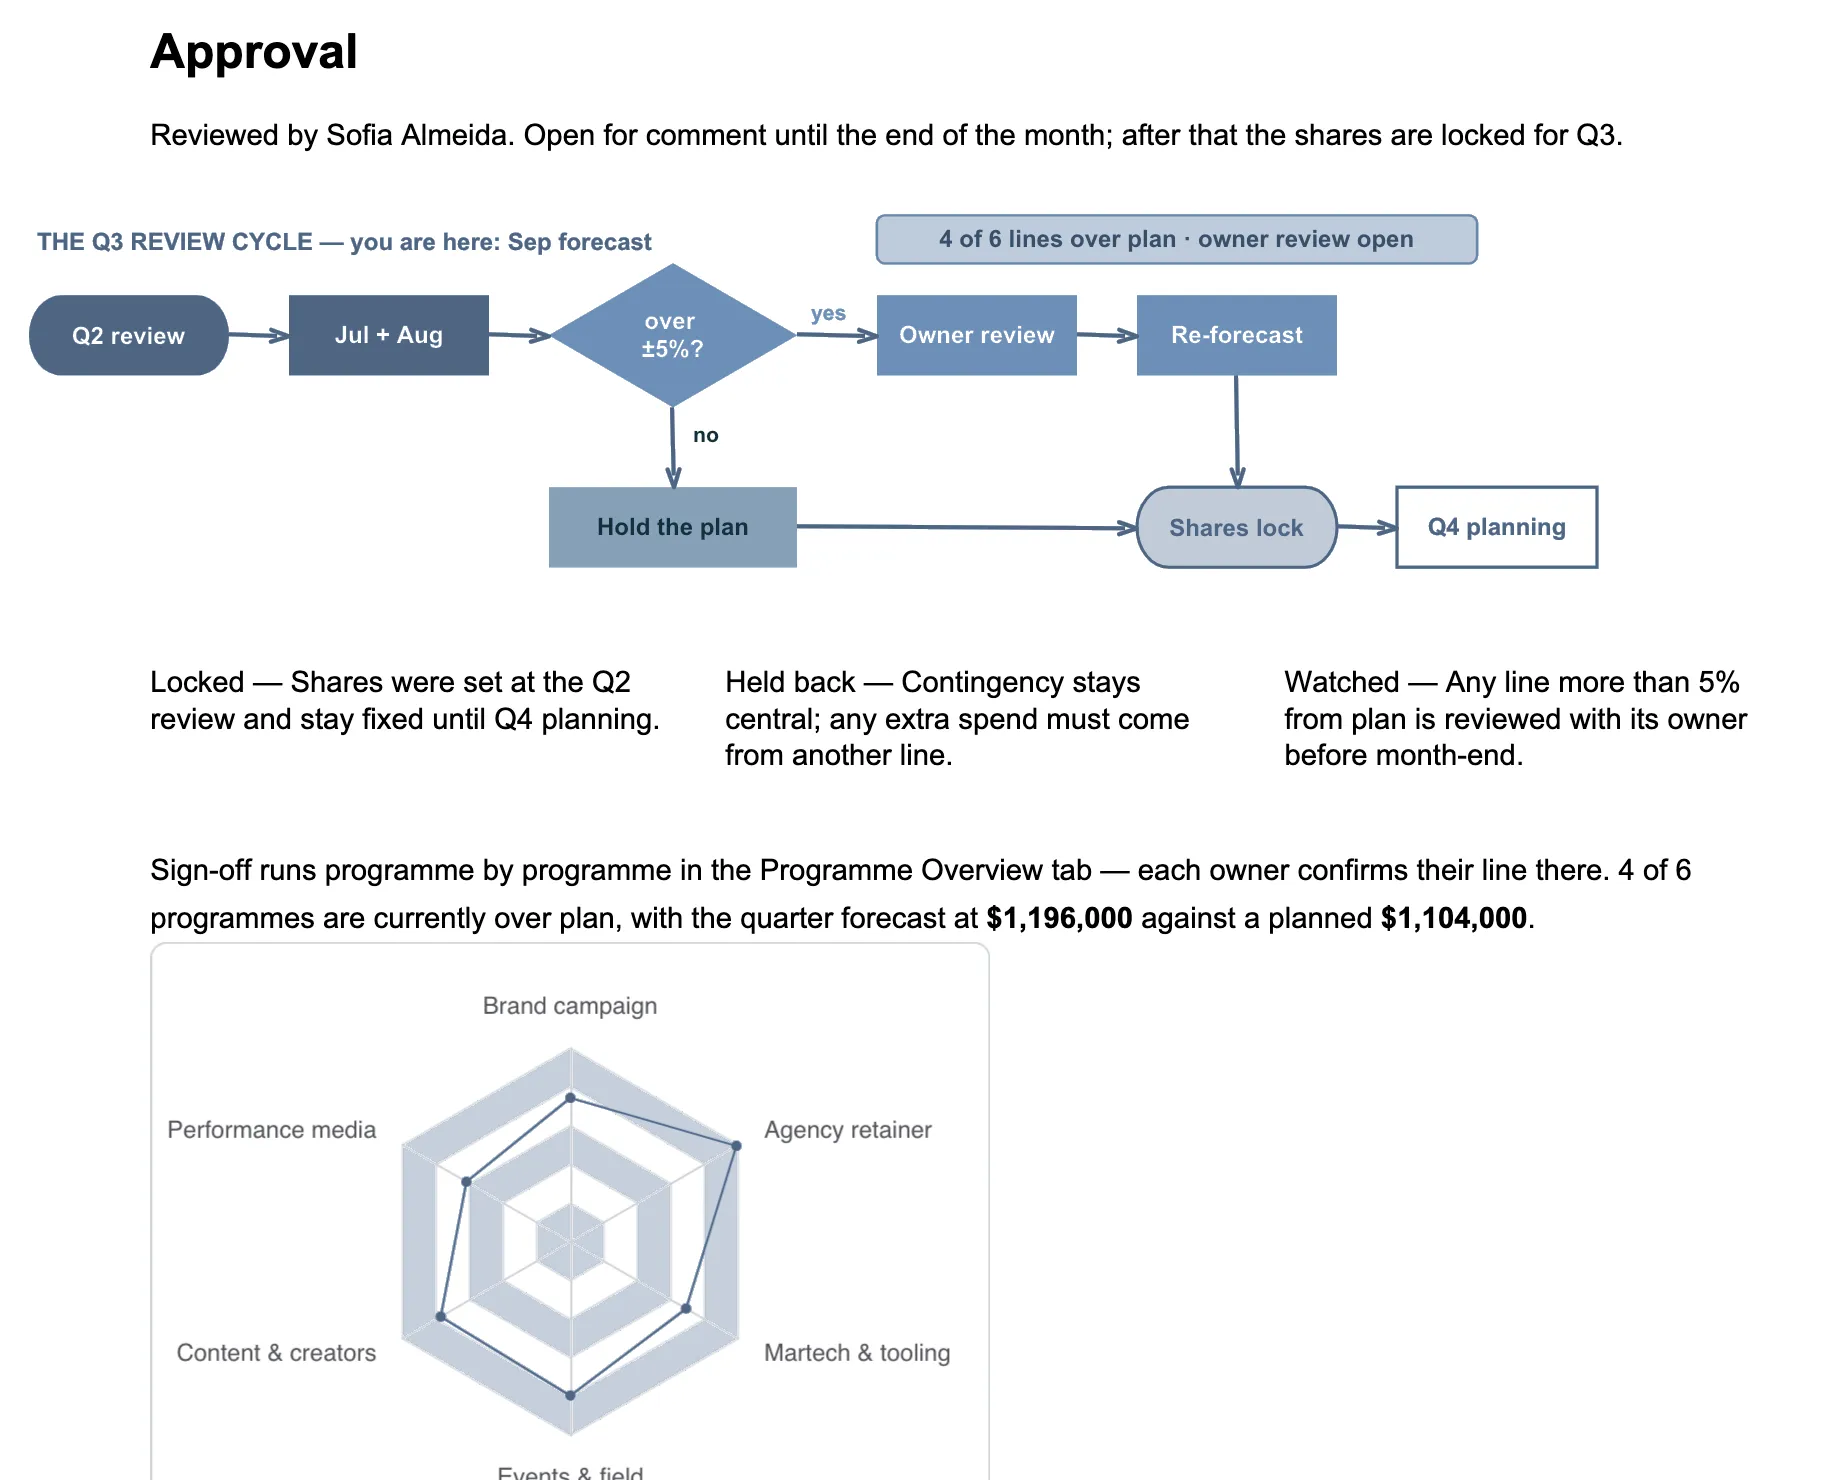
Paged layout and modern block editing, for documents people edit together.
- Headers, footers, sections, columns, page setup
- Tables, images, lists, equations, code blocks
- Embedded charts and Office content
Slides
Editable presentations from data, docs and visuals, so your team can refine what agents produce.
- Text, charts, images, shapes, connectors
- Embedded sheets and docs, linked to source data
- Page setup, transitions, import and export
Canvases
An infinite canvas to organize content, map processes and connect your Office tools.
- Flowcharts, mind maps, swimlanes, sticky notes
- UML and entity-relationship diagrams
- Embedded sheets, charts and Office content
Relational Tables
Records, fields and relations for business data and workflows: one set of records, many views.
- Grid, kanban, calendar, Gantt and gallery views
- Text, date, attachment, link and formula fields
- Filter, sort and group each view
PDF Editor
View and edit PDFs, organize pages, handle forms, then print and deliver.
- Edit text, images and tables
- Merge files, reorder pages, fill forms
- View, print and export
Process and calculate without a UI
Read and change content and fill templates in Node.js, and calculate with the Rust formula engine, with no editor open. Built for batch files and agent tasks; the results load back into the editor for people to keep working.
~/jobs ❯ node quarterly-reports.mjs
Read report template
Fill reports from data32/32
Calculate with the Rust formula engine
Write results for the UI
Done: 32 reports
~/jobs ❯
Two-way binding between Web Apps and cells
Bind inputs and sliders to specific cells. Changing a value writes to the sheet and recalculates; editing the sheet updates the bound inputs, metrics and charts. Formulas and rules stay in the sheet.
FY2027 Budget
- FY revenue
- 5,735
- Profit
- 1,943
- Margin
- 33.9%
| A | B | C | |
|---|---|---|---|
| 2 | Growth | ||
| 3 | Q1 revenue | 1,200 | 1200 |
| 4 | Q2 revenue | 1,344 | =B3*(1+$B$2) |
| 5 | Q3 revenue | 1,505 | =B4*(1+$B$2) |
| 6 | Q4 revenue | 1,686 | =B5*(1+$B$2) |
| 7 | FY revenue | 5,735 | =SUM(B3:B6) |
| 8 | Profit | 1,943 | =B7-Costs |
| 9 | Margin | 33.9% | =B8/B7 |
Live sheets in docs and slides
Embed a sheet in a doc or slide and keep cell editing and formula calculation. People adjust data and formulas in place to finish the report or deck, with less copy-paste and double upkeep.
FY2027 Budget Review
| A | B | C | D | E | |
|---|---|---|---|---|---|
| 1 | Q1 | Q2 | Q3 | Q4 | |
| 2 | Revenue | 1,200 | 1,344 | 1,505 | 1,686 |
| 3 | Operating profit | 340 | 428 | 529 | 646 |
| 4 | Margin | 28.3% | 31.8% | 35.1% | 38.3% |
Slide 3
Quarterly profit
Works with common Microsoft Office formats
Import existing Excel, Word and PowerPoint files, keep working, then export to deliver. Reuse your team’s templates, models and reports with less migration.
| Content | Import | Export |
|---|---|---|
| Sheets | XLS, XLSX, CSV, TSV | XLSX, CSV, TSV |
| Docs | DOC, DOCX | DOCX |
| Presentations | PPT, PPTX | PPTX |